A clear liquid in a vial may look like water, ethanol, or dozens of other substances. Chemists need evidence that goes beyond color and appearance. Infrared spectroscopy provides one useful kind of evidence by measuring how a sample absorbs infrared light at different frequencies. The pattern helps reveal which kinds of chemical bonds and functional groups may be present. It does not by itself supply a complete, unambiguous molecular identity, but it can sharply narrow the possibilities.
Molecules can absorb particular frequencies
Atoms in a molecule are joined by bonds that can stretch and bend. These motions occur at characteristic ranges of vibrational frequency, influenced by the masses of the atoms and the strength and environment of the bonds. When infrared radiation interacts with a molecular vibration that changes the molecule’s dipole moment, absorption may occur at a corresponding frequency. This is the physical basis of infrared spectroscopy. Not every vibration produces a strong infrared absorption, so the absence of a large peak must be interpreted carefully.
Infrared spectra are commonly plotted against wavenumber, measured in inverse centimeters. A typical mid-infrared scan covers a region roughly from 4000 down to 400 cm⁻¹. Wavenumber increases with frequency, but many published charts place high wavenumbers at the left rather than the right. Beginners sometimes misread the direction of the axis and confuse absorption intensity with the position of a band. Reading the axes before naming any functional group is an elementary but valuable laboratory habit.
What a spectrum looks like
An infrared spectrum is usually a series of bands rather than a tidy collection of single spikes. Some instruments display transmittance, where strong absorption appears as a downward trough; others show absorbance, where strong absorption points upward. Bands vary in width and intensity. Intermolecular interactions, especially hydrogen bonding, can broaden certain absorptions, and overlapping vibrations can make a region look complicated. A spectral pattern is therefore evidence to interpret, not a barcode that always identifies one substance without ambiguity.
The region above roughly 1500 cm⁻¹ often contains bands that are useful for identifying functional groups. Carbonyl-containing compounds commonly show strong absorption associated with C=O stretching in the neighborhood of 1650–1800 cm⁻¹, with the exact position depending on the molecular environment. O–H stretching can appear over a broad range and may look especially wide in hydrogen-bonded samples. C–H stretching typically occurs in characteristic regions too. These are ranges and tendencies, not inflexible rules for every molecule.
A carbonyl peak is a clue, not a conclusion
Suppose a sample shows a prominent absorption near 1715 cm⁻¹. A carbonyl group is one plausible explanation, but several classes of molecules contain carbonyls: ketones, aldehydes, esters, acids, amides, and others. Their frequencies overlap, shift with conjugation or hydrogen bonding, and depend on phase and experimental conditions. To make a defensible assignment, a chemist considers neighboring bands, the overall spectrum, and independent information about the sample.
Compare a ketone and an ester. Both can show strong carbonyl absorption, but their other vibrations differ, including certain C–O stretching regions. An alcohol might display an O–H feature without a carbonyl peak. Real mixtures make interpretation harder because bands from different compounds overlap. Spectroscopy can therefore support an identification, but an unexpected peak should prompt investigation rather than be dismissed to make the data fit the chemist’s preferred answer.
| Approximate IR region (cm⁻¹) | Common assignment | Interpretation caution |
|---|---|---|
| 3200–3600 | O–H stretching, often broad | Hydrogen bonding can shift and broaden the band |
| ~1650–1800 | C=O stretching in many carbonyl groups | Position varies with functional group and environment |
| ~2850–3100 | Many C–H stretches | Bands can overlap and are rarely unique identifiers |
The fingerprint region
The lower-wavenumber part of the spectrum, often described as the fingerprint region, contains a dense collection of bending and stretching vibrations. For complex molecules, the combination can be distinctive even when individual peaks are difficult to assign. Comparing an unknown spectrum with a reliable reference collected under suitable conditions may give strong evidence that the same substance is present. Yet spectral matching has limitations: impurities, solvents, moisture, instrument settings, and sample preparation can all affect the apparent result.
That is why reference libraries are useful but not infallible. A match score is a computational comparison, not a chemical proof detached from context. Chemists consider whether the proposed compound is plausible, whether the sample is pure, and whether other techniques agree. If two candidates have similar spectra, additional evidence may be required. An IR instrument is an analytical tool rather than an automatic naming device.
How the sample is measured
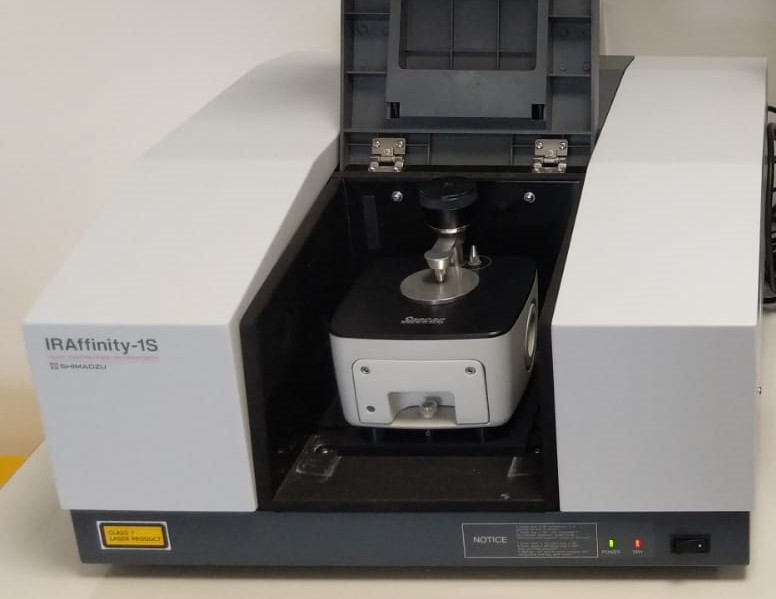
Modern laboratories often use Fourier-transform infrared spectroscopy, or FTIR. Instead of measuring each frequency independently with a simple scanning filter, an FTIR instrument collects an interferogram and computes a spectrum through a mathematical transform. The instrument must be calibrated and operated with suitable background measurements. The exact sample setup affects which parts of the spectrum are reliable and how strongly a material absorbs.
Attenuated total reflectance, or ATR, is a convenient approach for many liquids and solids. The sample contacts a crystal, and infrared light interacting near the crystal surface provides an absorption pattern. ATR can simplify preparation, but the result may not be directly identical to a transmission spectrum. Contact pressure, particle size, sampling depth, and data processing matter. Analysts should record how the measurement was made rather than treating every IR plot as equivalent.
A worked identification problem
Imagine that a student receives two unlabeled samples and is told that one is a simple alcohol and the other is a simple ketone. One spectrum shows a broad absorption in the O–H stretching region and no strong carbonyl feature; the other has a prominent carbonyl-region band but lacks the same broad O–H pattern. Under the stated assumption that the samples are reasonably pure and the candidate list is limited, the assignment is straightforward. Without that restricted choice, the evidence would justify fewer claims.
The same experiment could go wrong if water contaminates the samples or if the solvent contributes absorptions. A student might misidentify a broad feature or overlook a baseline problem. A careful report notes these possibilities and compares the measurements with suitable references. It also avoids claims about molecular structure that cannot be distinguished by the data. Spectroscopy trains chemists to separate what a measurement supports from what is merely possible.
What IR cannot answer alone
Infrared spectroscopy is excellent for many questions about functional groups and sample identity, but it does not generally reveal an entire molecular connectivity map. Nuclear magnetic resonance spectroscopy provides complementary structural information, mass spectrometry helps determine masses and fragmentation patterns, and chromatographic methods can separate mixture components. UV–visible spectroscopy addresses other kinds of electronic transitions. Which method is most useful depends on the question, not on a hierarchy in which one instrument is always superior.
IR is also used to follow reactions, compare materials, and check quality. If a characteristic functional-group band disappears while a new one appears, that can support evidence that a transformation occurred. It does not automatically establish yield, purity, or mechanism. Those require the right measurements and controls. An analyst may need to know the temperature, solvent, concentration, and handling history before comparing spectra collected at different times.
From spectrum to chemical argument
A good IR interpretation makes a modest, testable claim: particular bands support the presence or absence of certain functional groups under the measurement conditions. It then compares that interpretation with other evidence. That discipline fits a larger lesson of chemistry—molecules can be inferred from the measurable consequences of their structure, but an inference should match the information actually collected. Our articles on Why Atoms Bond and Gibbs Free Energy explore different links between molecular structure, energy, and observable behavior.
References and further reading
- FT-IR/ATR — University of Florida
- Interpreting Infrared Spectra — Chemistry LibreTexts
- NIST Chemistry WebBook
Featured image: Keshavana · CC BY-SA 4.0.